


Les om hvordan vi har jobbet med kunder i ulike bransjer

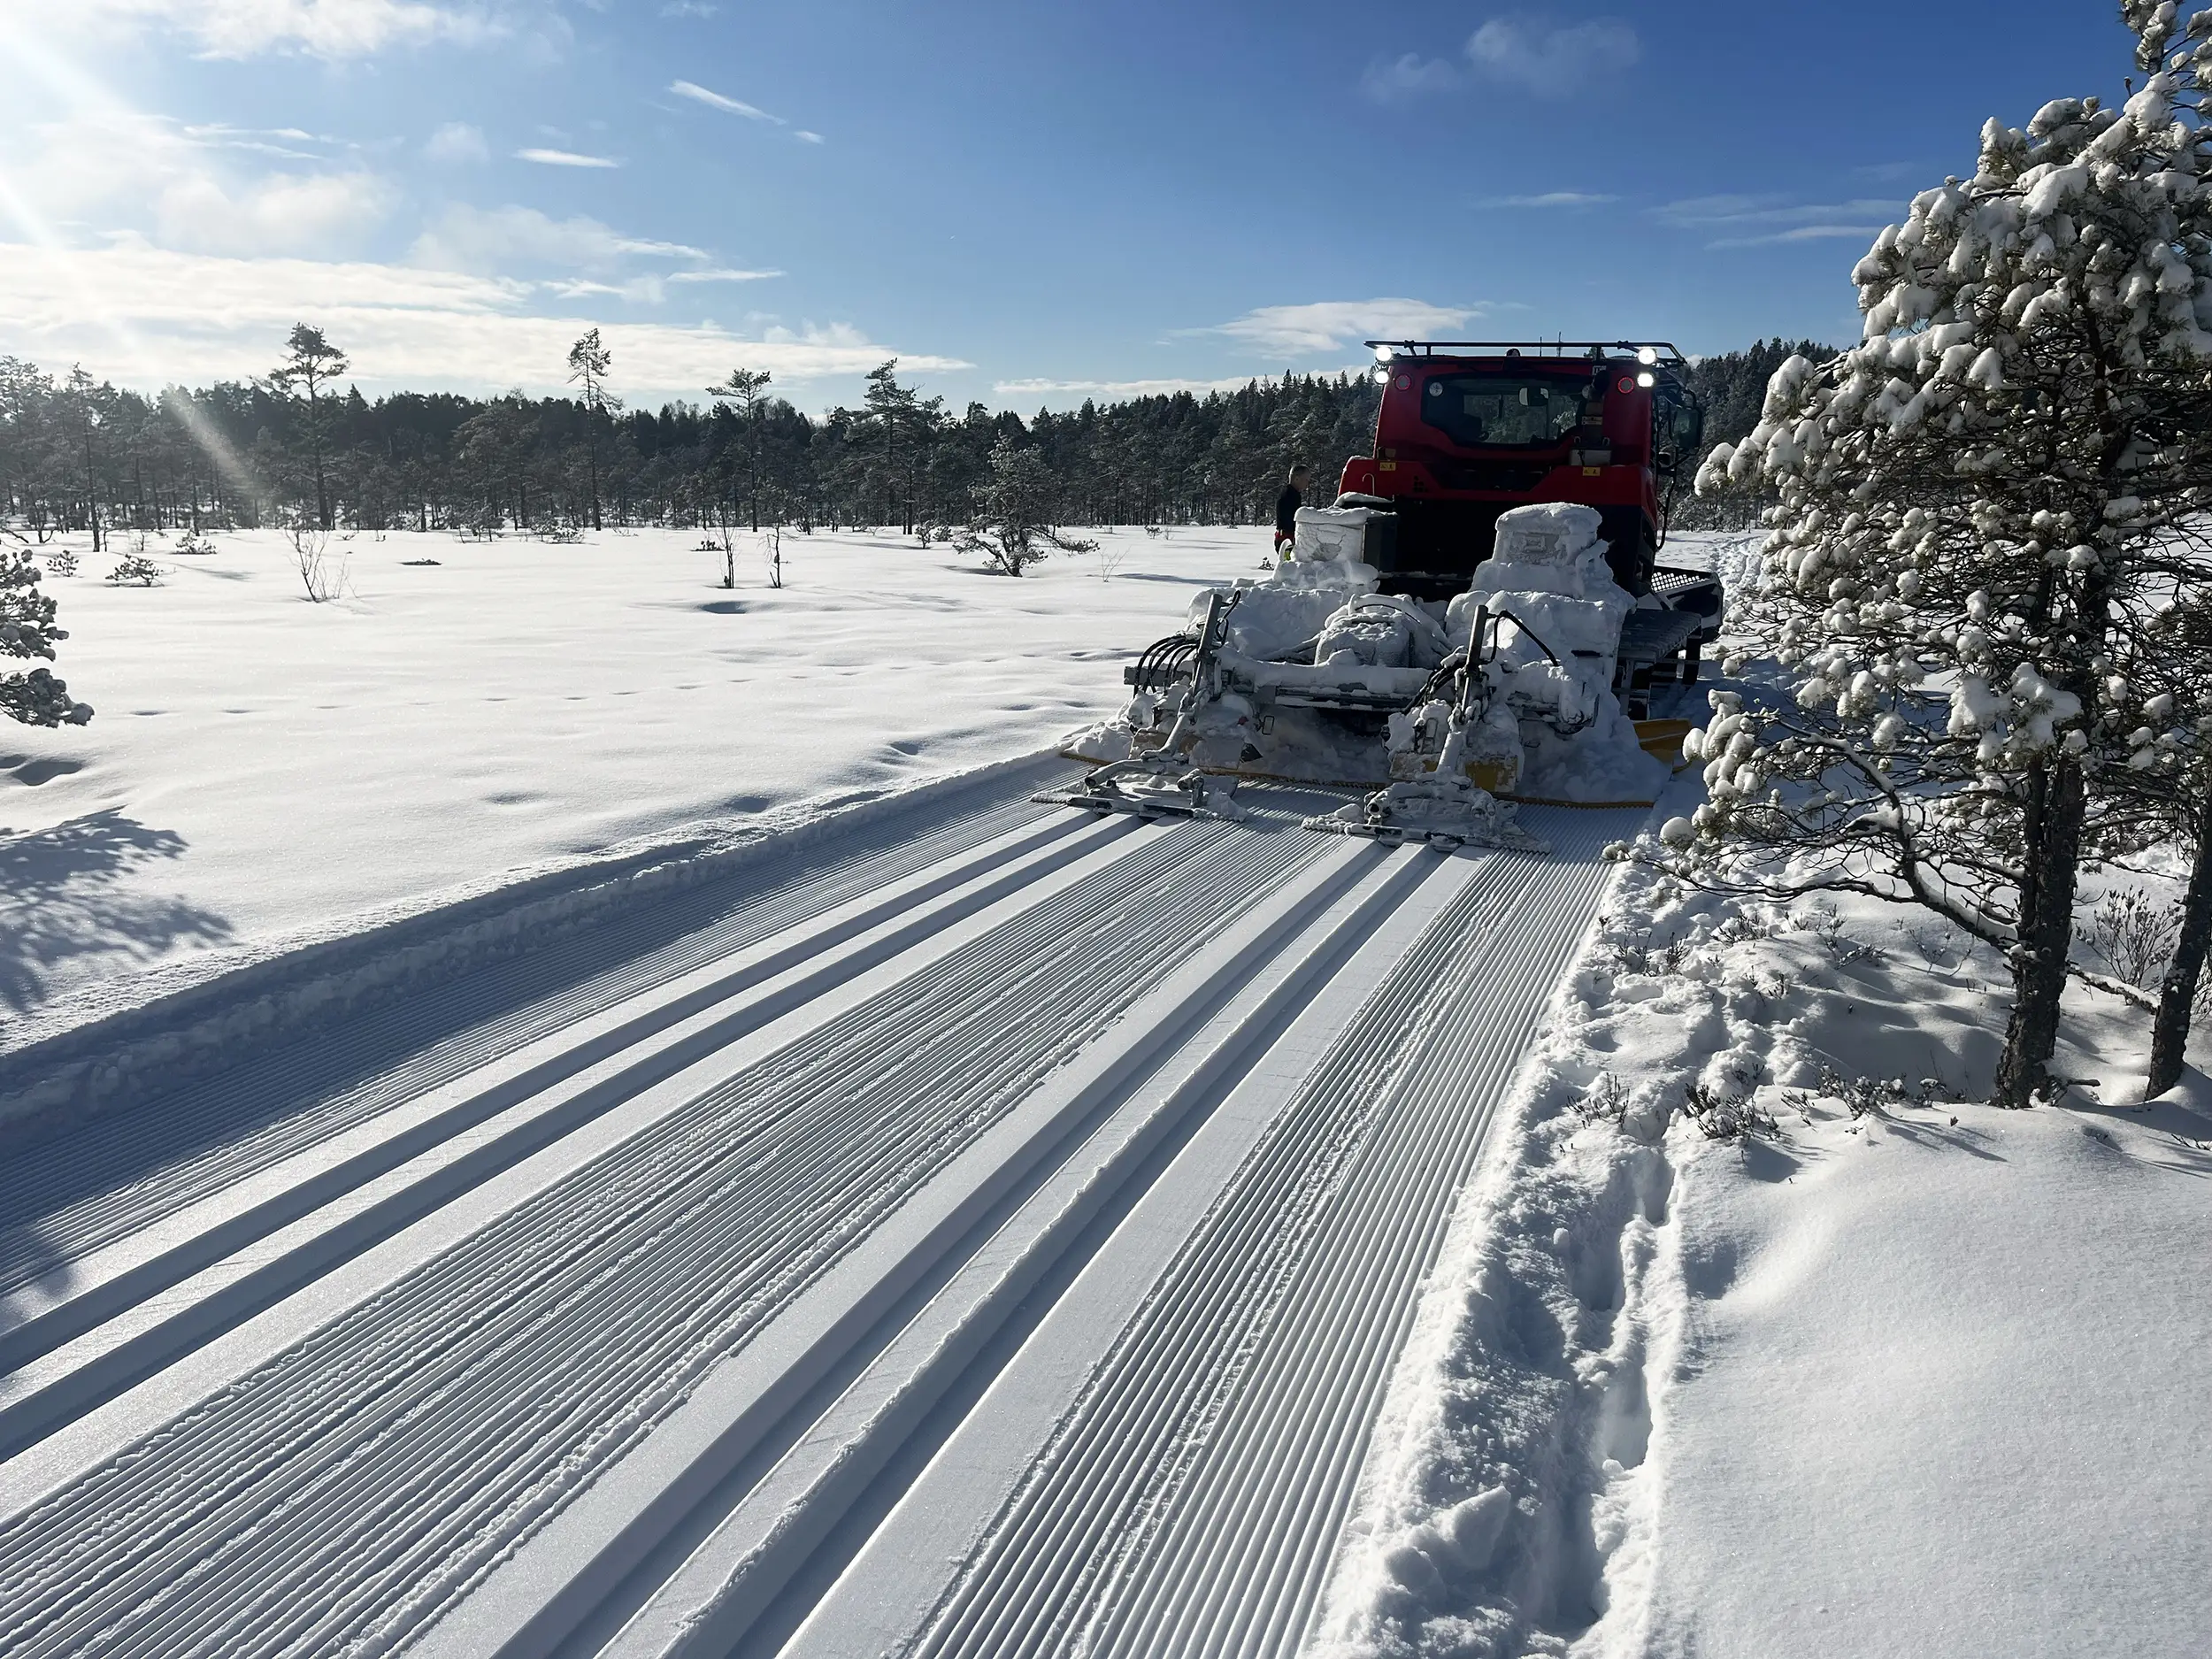
UX i sentrum for Skiforeningens nye løypekart-løsning
Ideelle organisasjoner

Snart 20 år med ArcGIS: Avinor samler alle geografiske data i én plattform
Samferdsel og infrastruktur


Digitaliserer Hafslund
Kraftproduksjon og distribusjon


Slik jobber vi med kundene våre

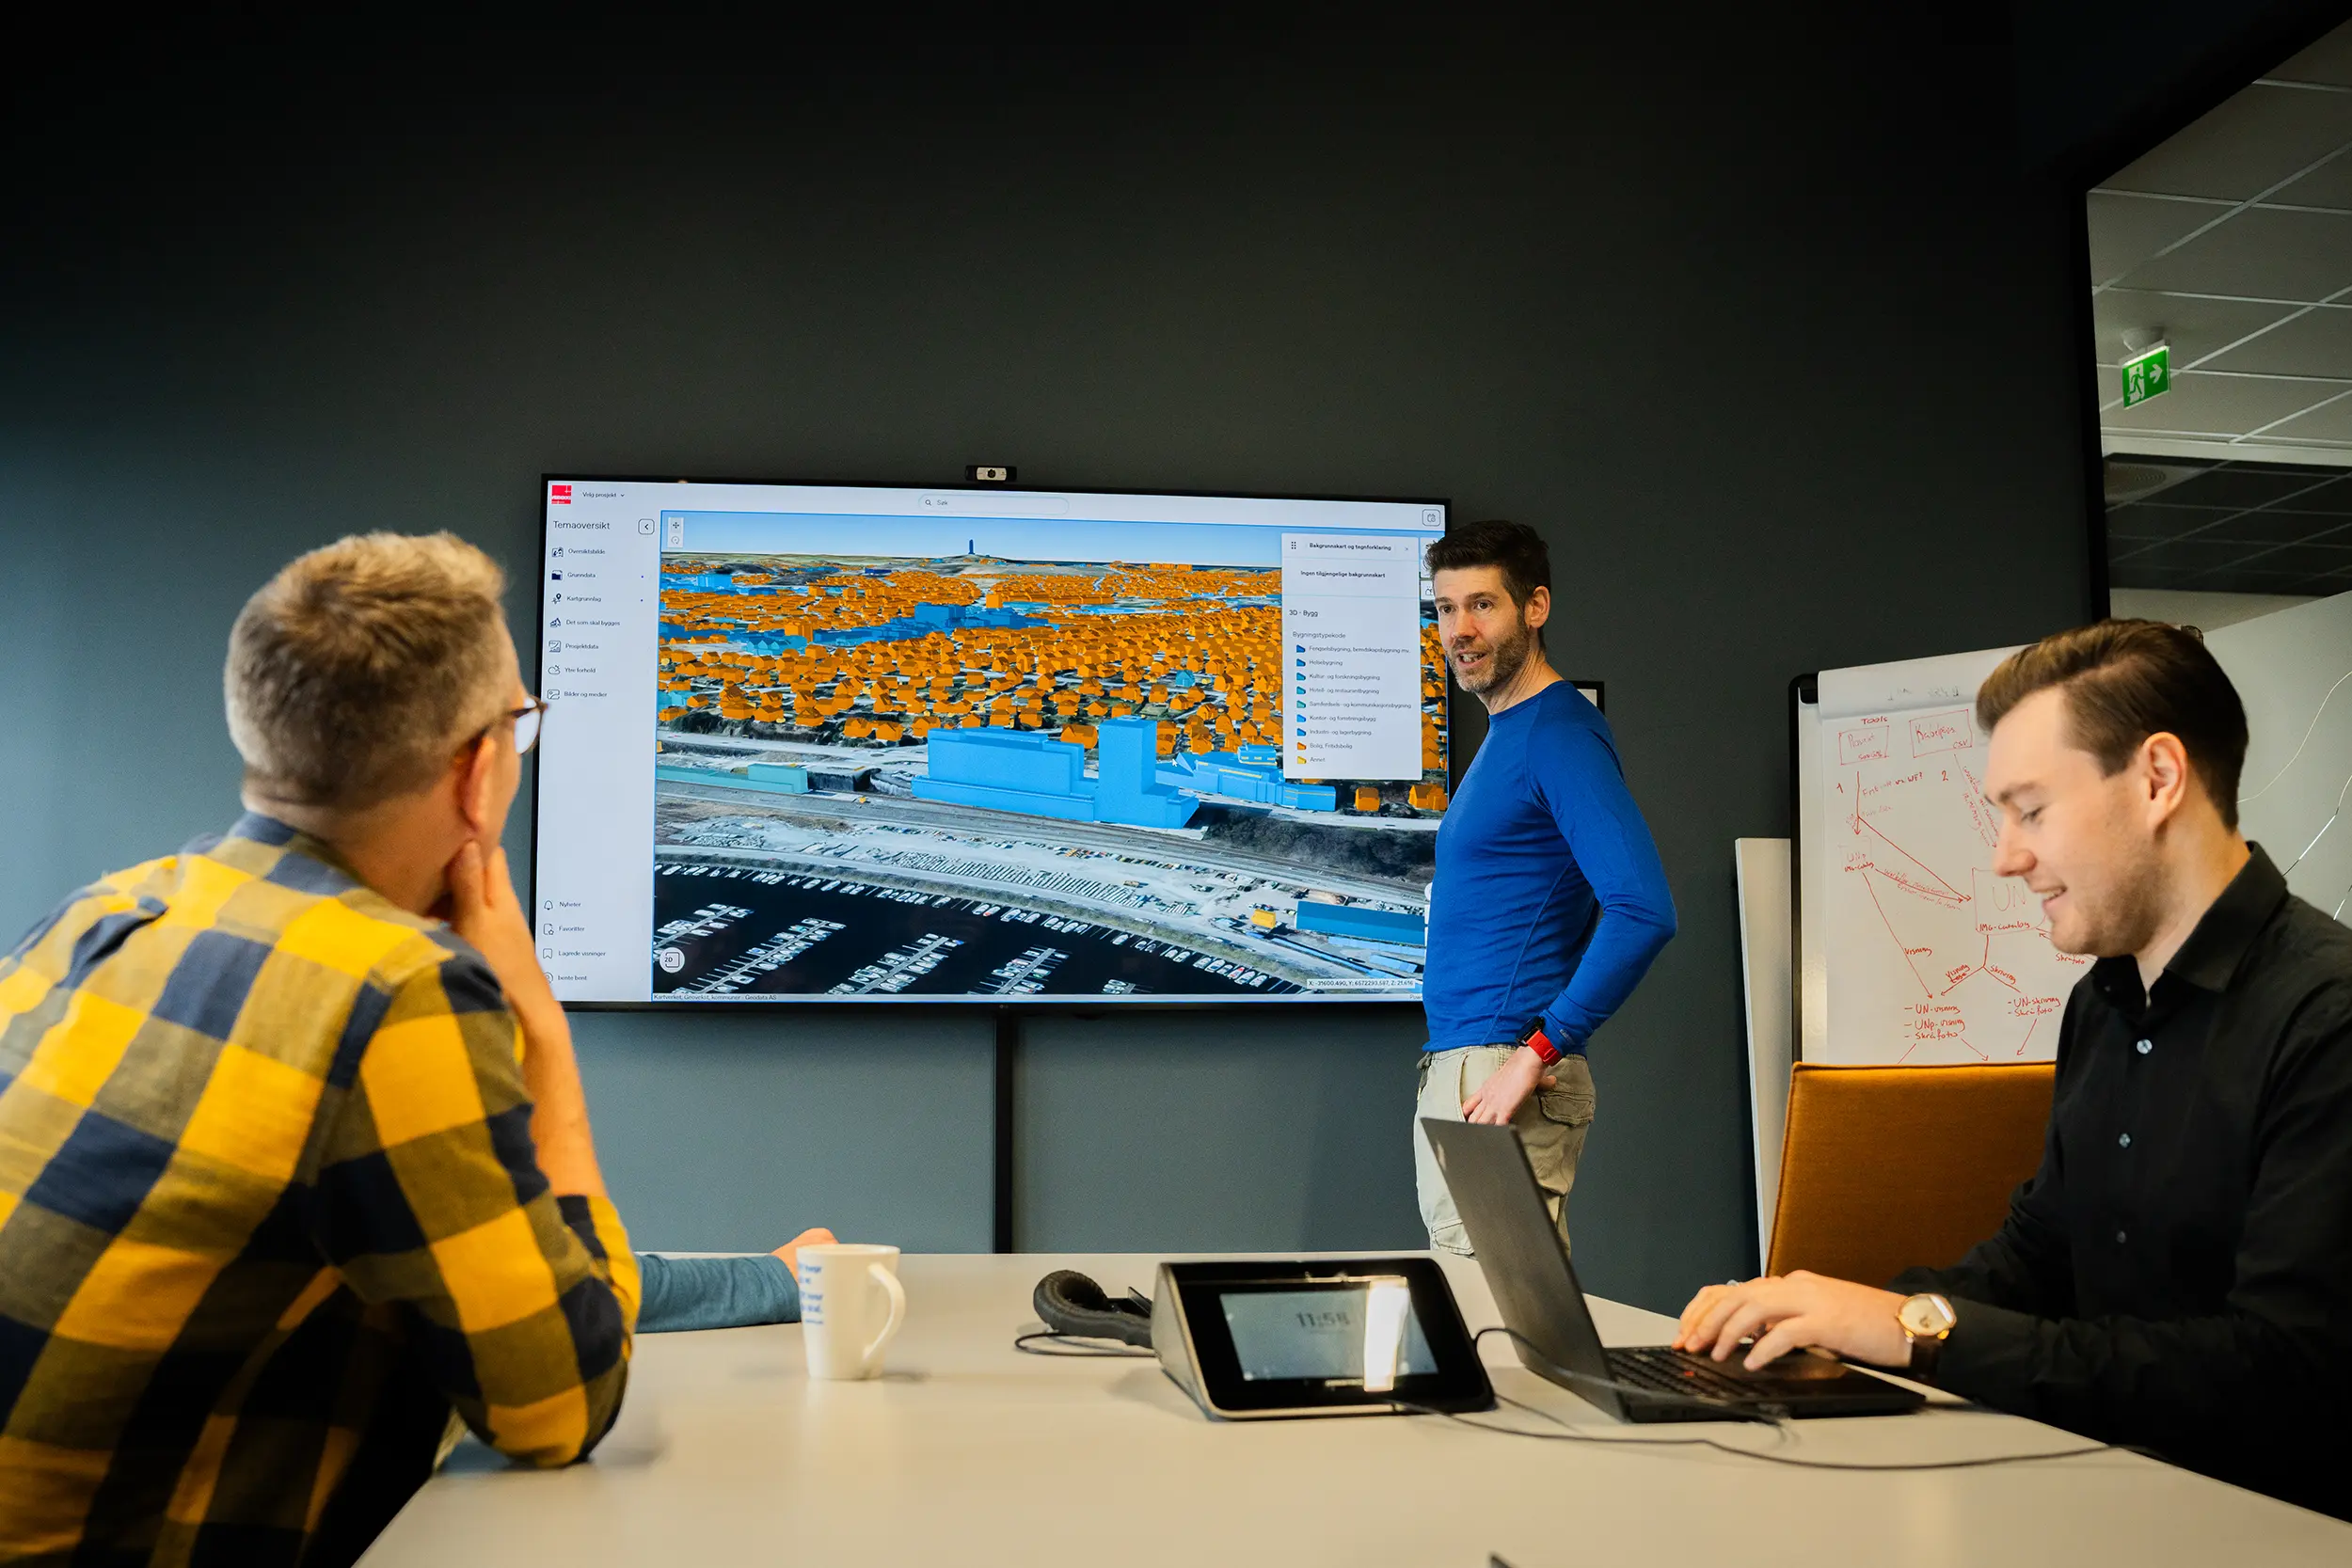
Bygg og anlegg
Geodata tilbyr løsninger som digitaliserer hele prosjektets livsløp, fra planlegging til overlevering, med ArcGIS som samlingspunkt for all geografisk informasjon. Vi legger til rette for papirløse byggeplasser og effektiv samhandling mellom aktører gjennom sømløs dataflyt og visualisering. Les mer her.
Detaljhandel
Vi leverer Location Analytics som gir innsikt i kundegrunnlag, konkurranse og markedsmuligheter. Geodata gjør det enkelt å analysere geografiske forhold og identifisere de beste stedene for etablering, ekspansjon eller flytting av butikker og kontorlokaler. Les mer her.
Fornybar energi
Geodata hjelper aktører innen sol- og vindkraft med geografiske analyser for å finne optimale plasseringer og vurdere energi potensial. Med ArcGIS gir vi innsikt som støtter bærekraftige valg, effektiv prosjektutvikling og beslutningsgrunnlag for investeringer. Les mer her.
Ideelle organisasjoner
Vi gir ideelle organisasjoner tilgang til kraftige GIS-verktøy til rabatterte priser gjennom Esris nonprofit-program. Geodata tilbyr rådgivning og teknologi som hjelper organisasjoner med å analysere innsats, planlegge aktivitet og dokumentere effekt i kart og data. Les mer her.
Kommune og fylkeskommune
Geodata leverer Geodata Origo – en helhetlig plattform for datadeling, analyse og tjenesteutvikling i kommunal sektor. Vi hjelper kommuner med å integrere GIS i sine digitale økosystemer og styrke beslutningsgrunnlaget innen planlegging, beredskap og innbyggertjenester. Les mer her.
Kraftproduksjon og distribusjon
Vi bistår kraftselskaper med teknologi for å modellere, visualisere og forvalte strømnett og produksjonsanlegg. Geodata tilbyr moderne GIS-løsninger som erstatter gamle systemer og støtter bærekraftig drift, planlegging av ny kraftproduksjon og regulatorisk samsvar. Les mer her.
Myndigheter
Geodata skreddersyr GIS-løsninger for myndigheter som trenger pålitelig innsikt til samfunnskritiske beslutninger. Våre systemer støtter alt fra miljøovervåking og naturkartlegging til beredskap, tilsyn og datadeling med offentligheten. Les mer her.
Olje og gass
Vi tilbyr en helhetlig GIS-plattform for petroleumsbransjen – med støtte til leteaktivitet, HMS, drift og strategi. Geodata leverer både programvare, rådgivning og integrasjon som gir bedre beslutningsgrunnlag og effektiv ressursutnyttelse på norsk sokkel. Les mer her.
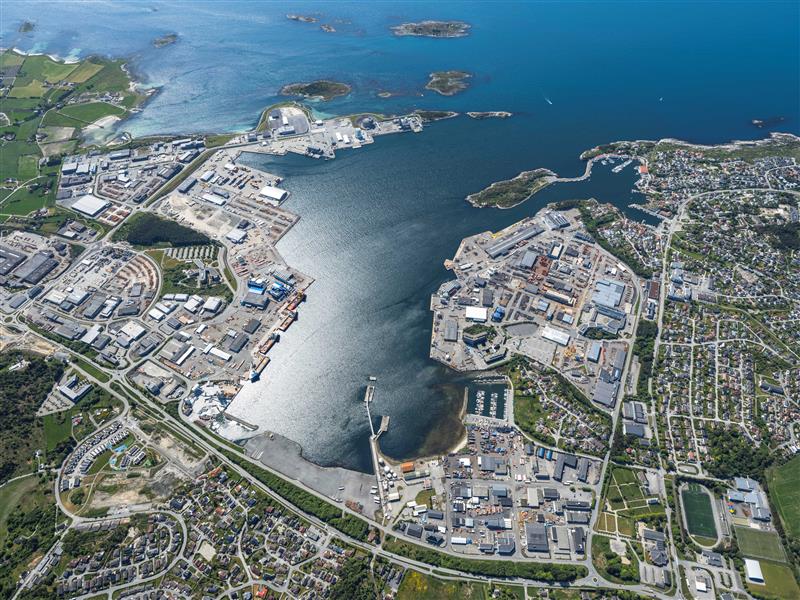
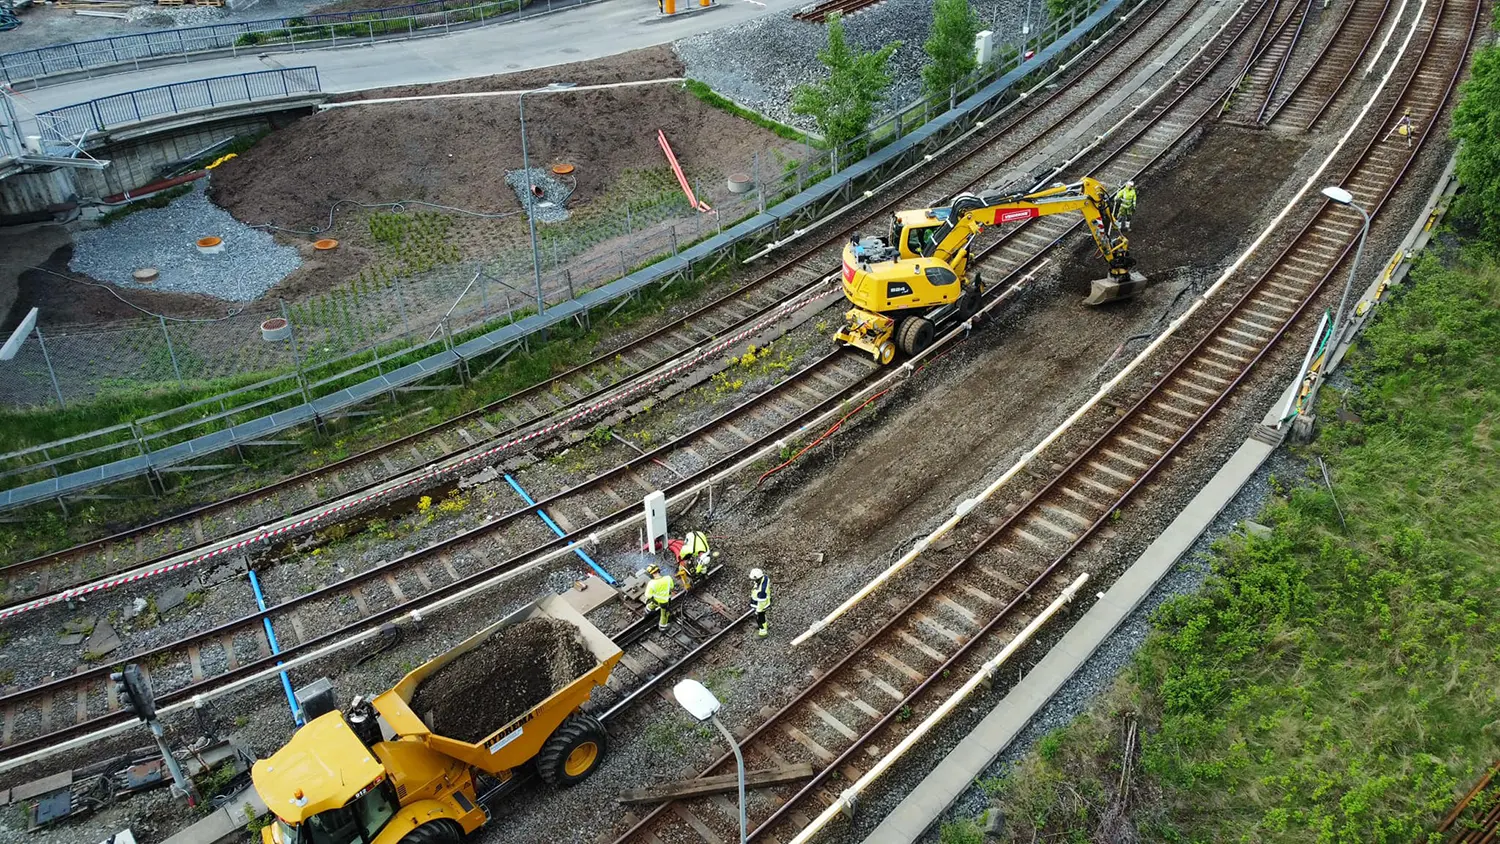
Samferdsel og infrastruktur
Geodata kombinerer GIS med BIM og 3D-teknologi for å støtte utvikling av framtidens infrastruktur. Vi hjelper virksomheter med planlegging, simulering og visualisering av komplekse prosjekter – fra offentlige transportsystemer til veinett og havner. Les mer her.
Sikkerhet og beredskap
Vi leverer driftssikre digitale kartløsninger og sanntidsanalyser som hjelper nødetater med å reagere raskt og effektivt. Geodata tilbyr verktøy for situasjonsforståelse, koordinering og beredskapsplanlegging – på tvers av etater og organisasjoner. Les mer her.
Telekom
Geodata hjelper telekombransjen med å effektivisere planlegging, utbygging og drift av fibernett. Våre GIS-løsninger gir bedre kontroll over infrastruktur, og støtter alt fra prosjektering og ressursstyring til dokumentasjon og kundeoppfølging. Les mer her.


Utforsk hva vi kan levere
Produkter
Tjenester

Kurs og opplæring
